Field Usability Testing: Mobile AR Trivia Game
Solo field research identifying critical UX barriers in early-stage AR gaming platform
Project Overview
Client: Early-stage mobile AR gaming startup
Timeline: Summer/Fall 2025
My Role: Lead UX Researcher
Team: Lead researcher with intern support for field operations
Methods: Mixed-methods field research, quantitative analysis (SPSS), qualitative interviews
Timeline: Summer/Fall 2025
My Role: Lead UX Researcher
Team: Lead researcher with intern support for field operations
Methods: Mixed-methods field research, quantitative analysis (SPSS), qualitative interviews
The Challenge
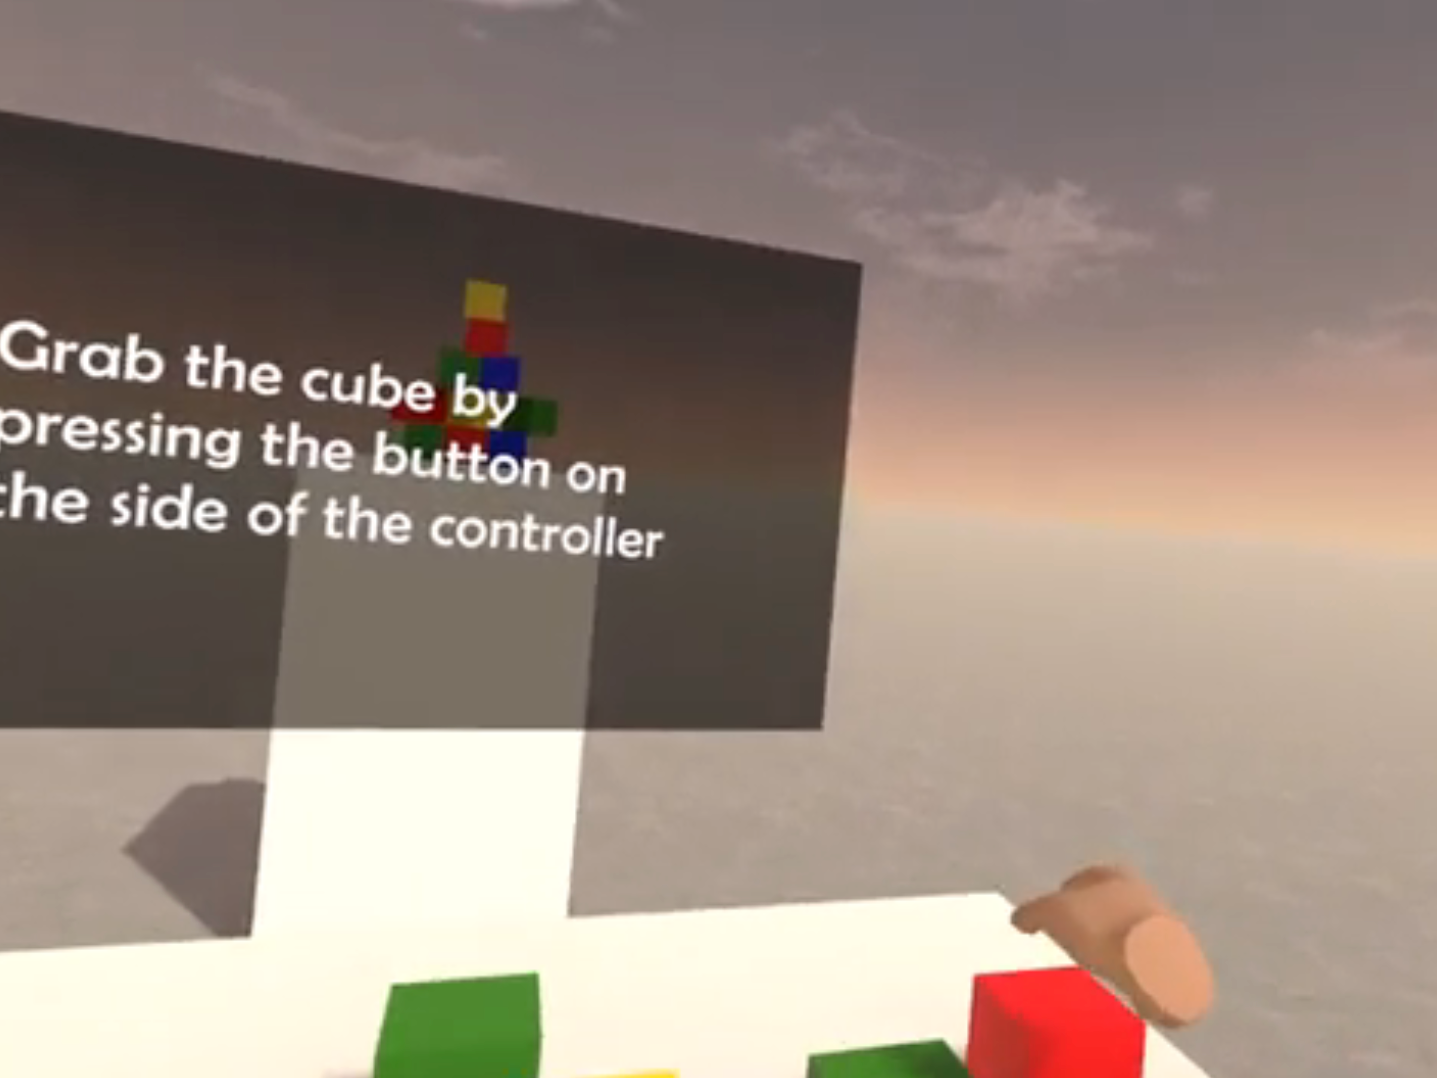
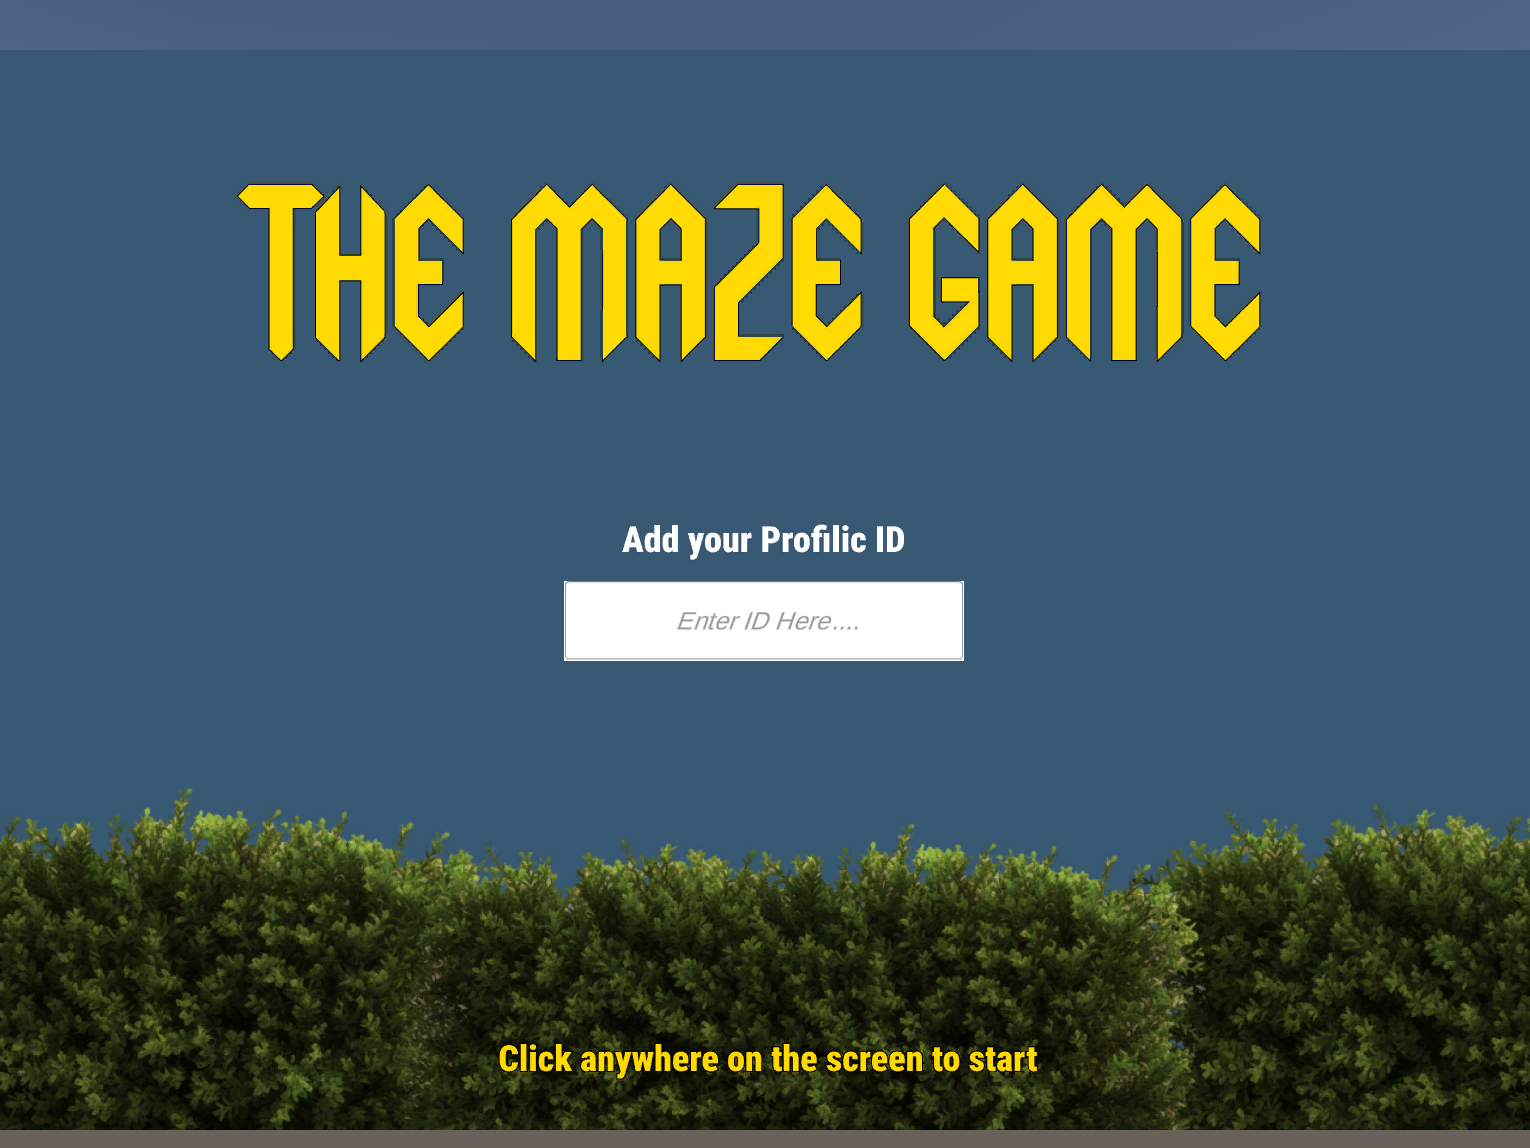
An early-stage AR gaming platform needed user validation before public launch. The product concept was innovative - an AI-powered trivia game with personalized question generation - but the team needed to understand whether users could actually navigate and enjoy the experience in real-world conditions.
I was tasked with designing and executing a field study that would:
Test usability in authentic social environments
Identify specific friction points blocking user satisfaction
Provide actionable, prioritized recommendations for the product roadmap
Generate data reliable enough for investor presentations
Research Constraints
This was high-difficulty field research:
Uncontrolled environment: Active nightlife venue during peak hours
Solo execution: I managed all aspects of research operations independently
Live conditions: Concurrent with regular bar service and existing trivia programming
No existing protocol: Required development of consent forms, survey instruments, and testing procedures from scratch
Research Approach
Study Design
Sample: 25 participants (mixed recruitment: in-person field testing + remote online panel)
Location: St. Dymphna's NYC (field testing); Prolific (online validation)
Instruments: Custom Likert-scale survey (1-5 scale), semi-structured interviews, behavioral observation
Location: St. Dymphna's NYC (field testing); Prolific (online validation)
Instruments: Custom Likert-scale survey (1-5 scale), semi-structured interviews, behavioral observation
Methodology
Quantitative Analysis:
Administered validated survey instrument measuring 5 key constructs: overall experience, navigation ease, engagement depth, interaction satisfaction, and overall satisfaction
Performed statistical analysis using SPSS including:
Descriptive statistics and distribution analysis
Reliability testing (Cronbach's Alpha)
Pearson correlation analysis to identify predictive relationships
Composite scoring to identify patterns across user segments
Qualitative Research:
Conducted semi-structured interviews with each participant
Observed user behavior in natural environment
Documented friction points, confusion patterns, and moments of delight
Synthesized open-ended feedback for thematic analysis
Field Operations
As lead researcher with intern assistance, I managed:
Participant recruitment and screening
Consent protocol administration
Live testing moderation and technical support
Survey distribution and collection
Incentive management (drink ticket system)
Real-time troubleshooting and user assistance
Data logging and quality control
This required maintaining research rigor while adapting to chaotic real-world conditions - noise, distractions, varying technical literacy, and competing attentional demands.
Key Findings
Statistical Reliability
Cronbach's Alpha = 0.786 (Strong internal consistency)
This indicates the survey instrument measured constructs reliably. User responses were consistent across related questions, confirming the data reflected genuine patterns rather than random noise. This gave credibility to the findings for both product development and investor reporting.
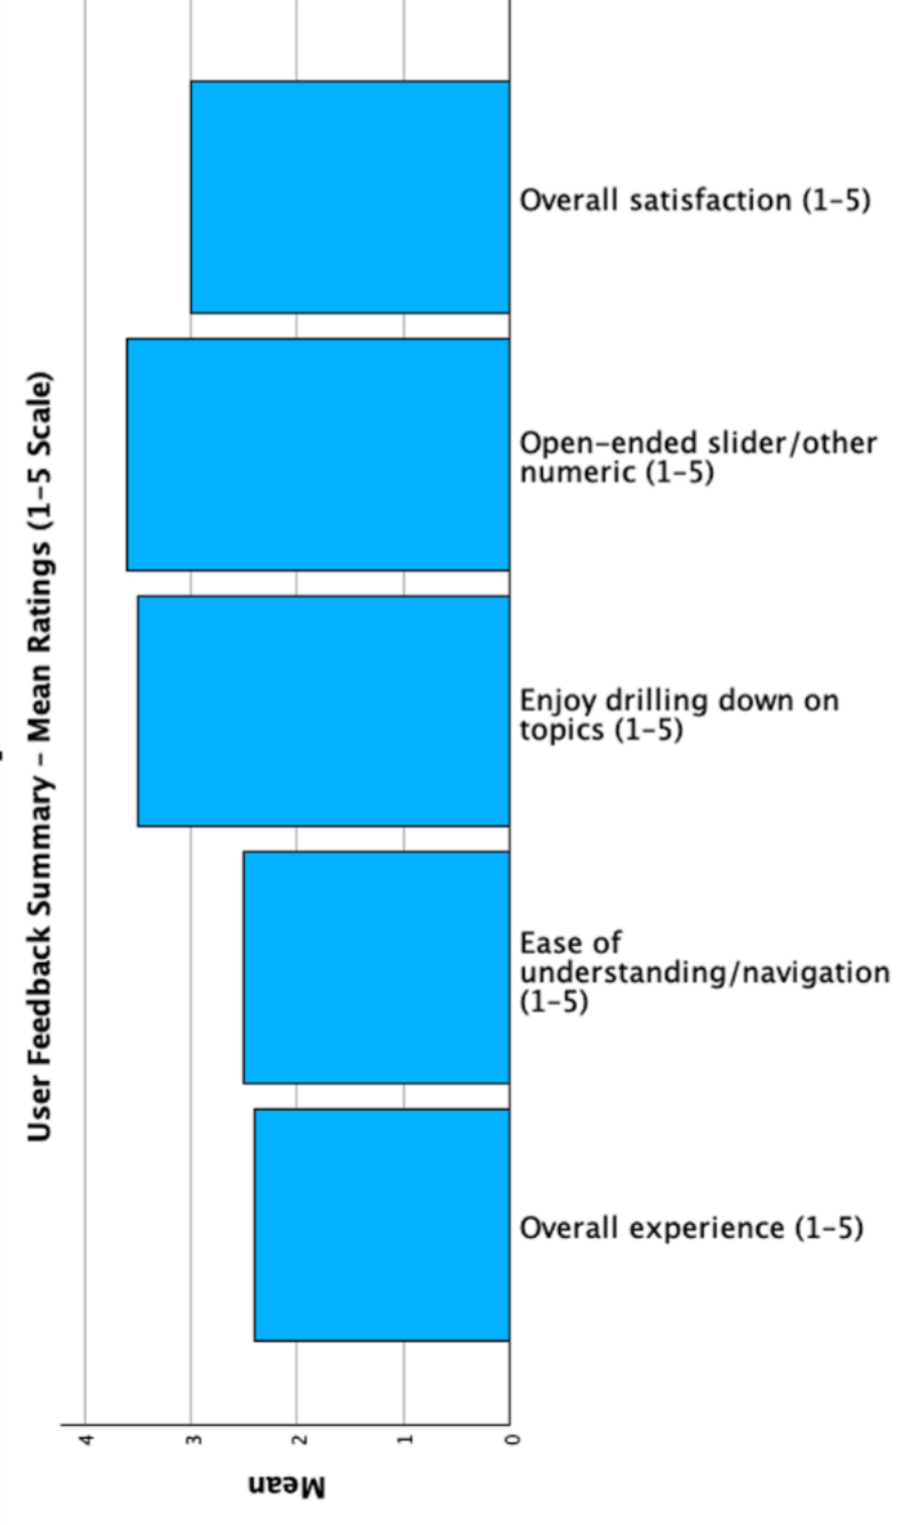
User Experience Snapshot
MetricMean Score (1-5)Std. DevInsight
Overall Experience 2.460.88 Below neutral - significant room for improvement
Enjoy Exploring Topics 3.701.08 Moderate engagement with content depth
Interaction Freedom 3.860.86 Users appreciated open-ended format
Overall Satisfaction 3.290.91 Average satisfaction - not yet "sticky"
Interpretation: Users showed curiosity and appreciated the concept, but execution issues prevented deep engagement. The product demonstrated promise but needed clearer onboarding and smoother navigation.
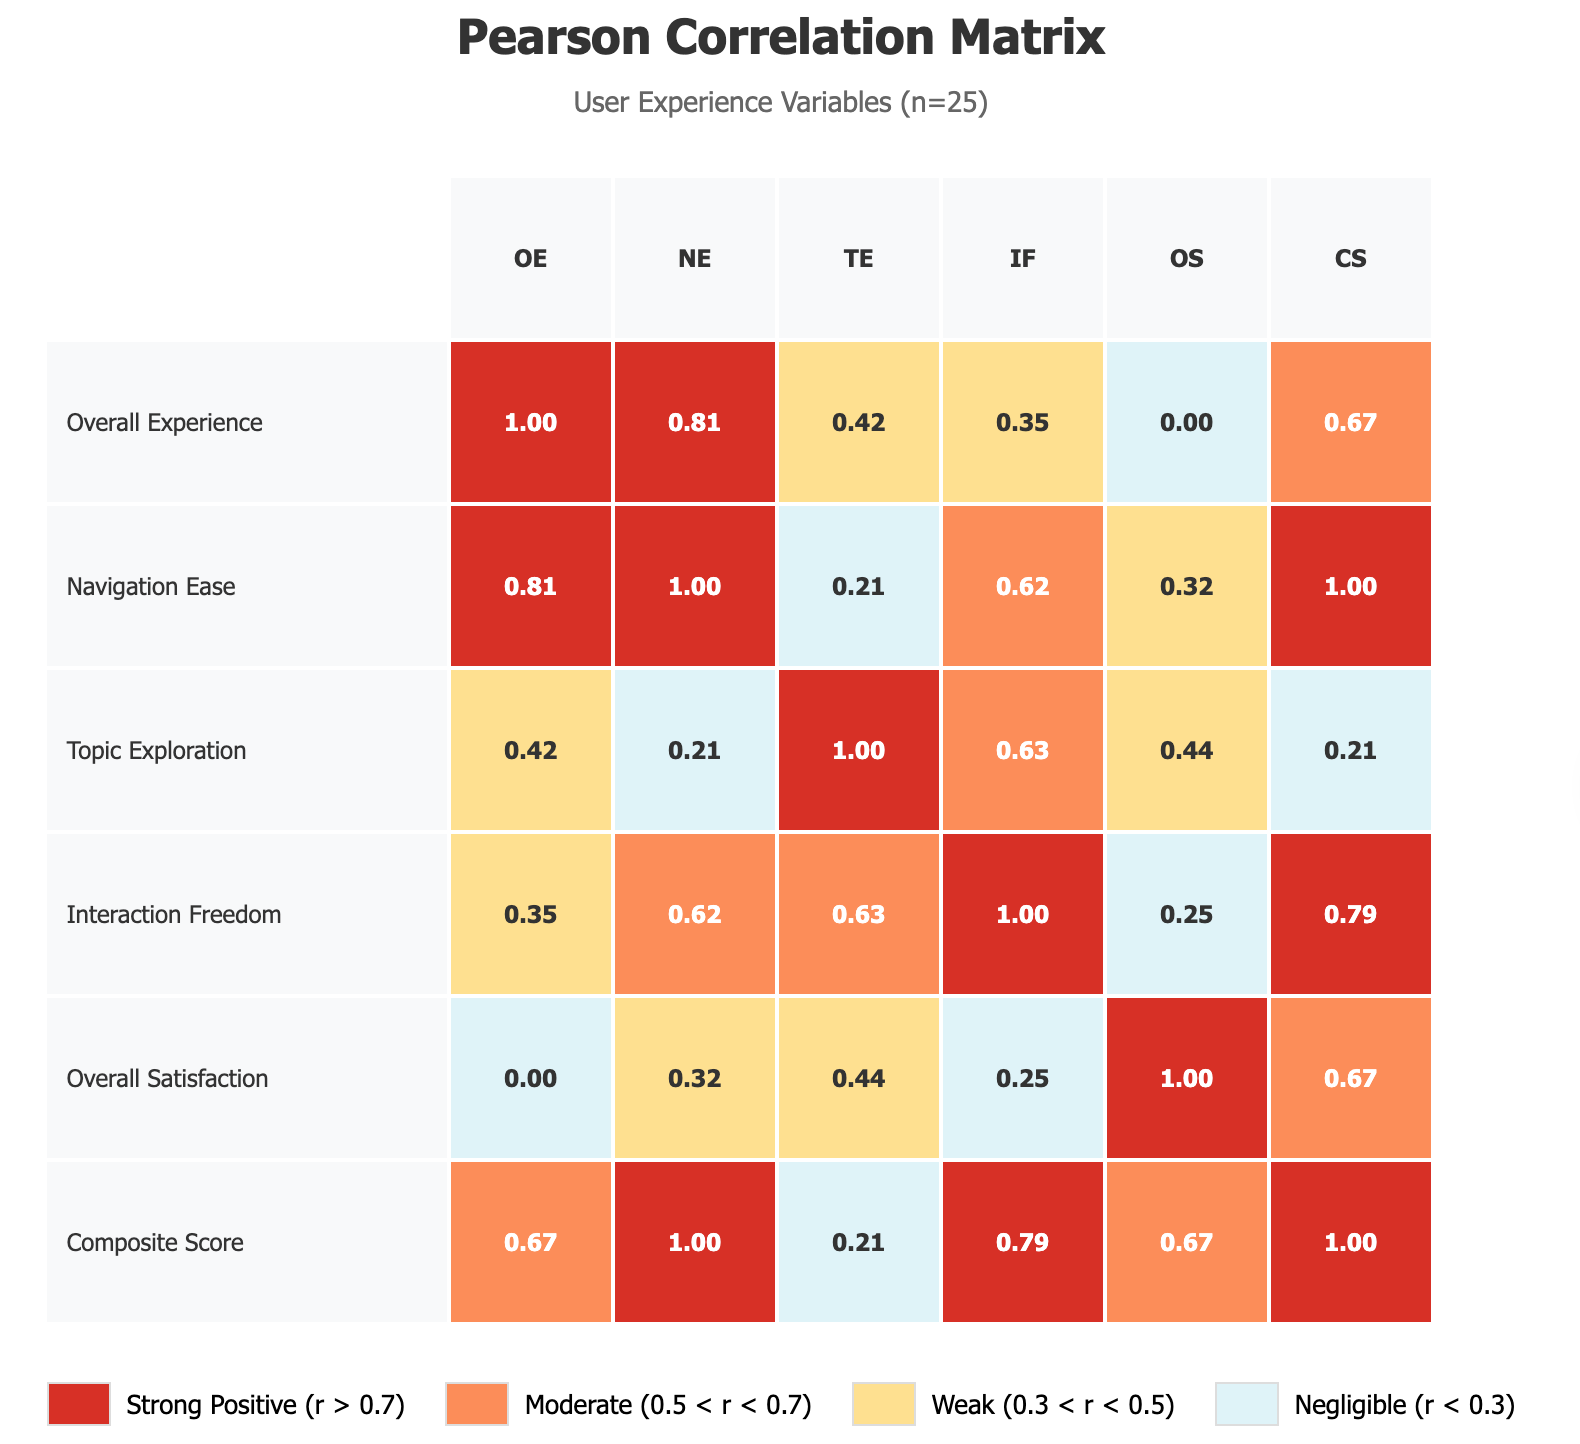
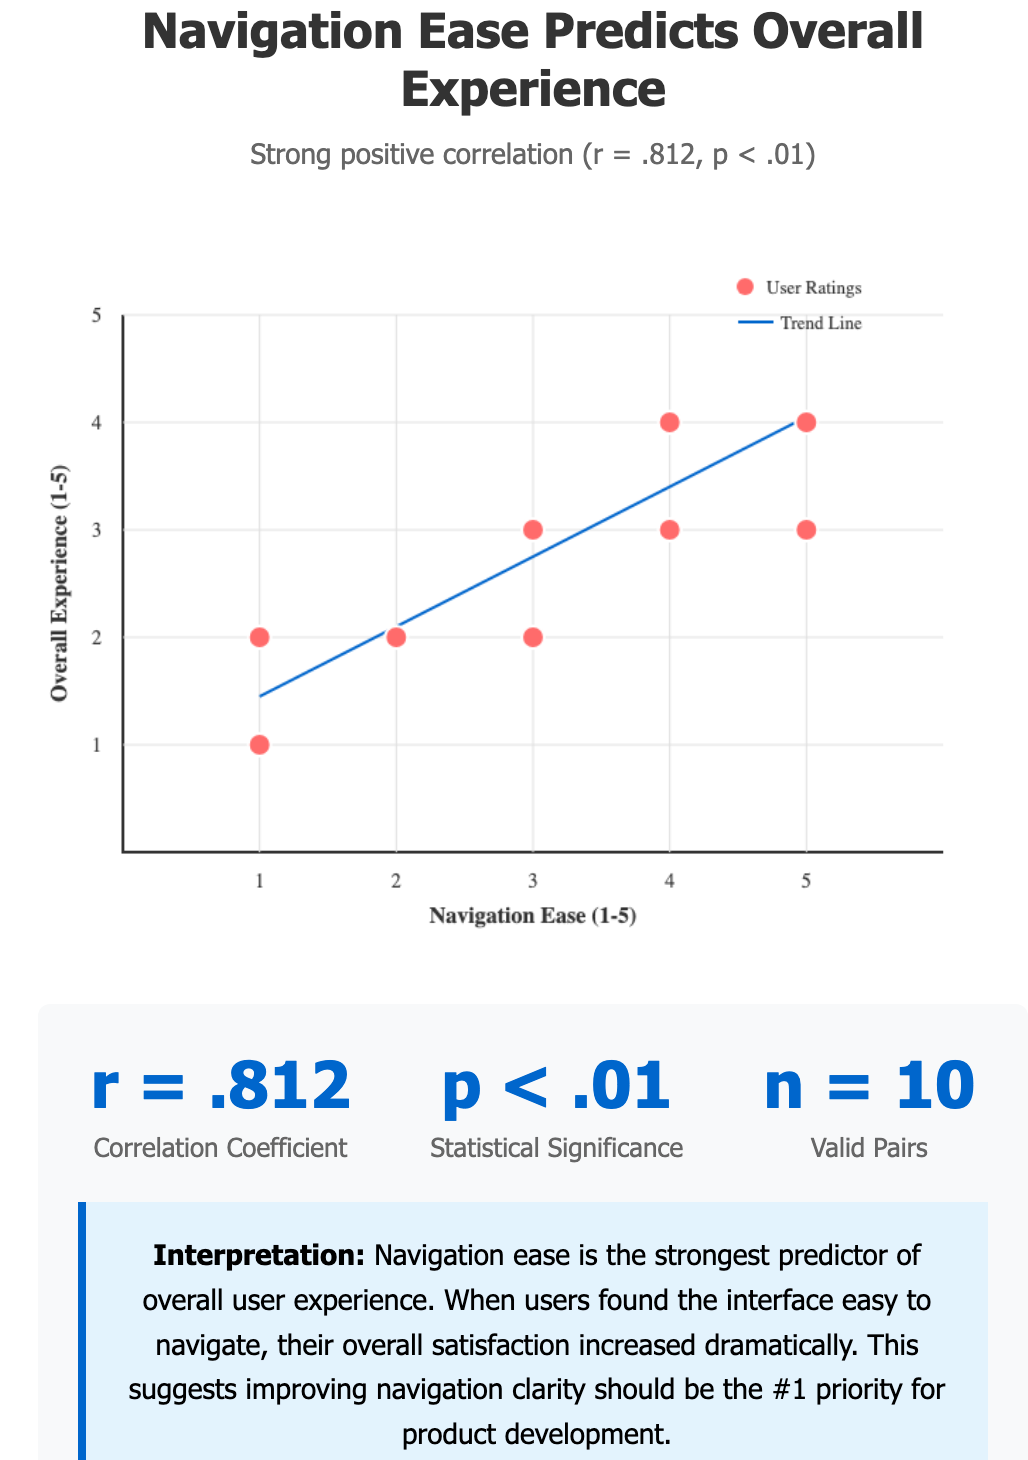
Critical Discovery: Navigation is the Bottleneck
Correlation analysis revealed navigation as the primary predictor of all satisfaction metrics:
Navigation ↔ Overall Experience: r = .812, p < .01
The smoother the navigation, the better users rated their entire experience
The smoother the navigation, the better users rated their entire experience
Navigation ↔ Composite Satisfaction: r ≈ .999, p < .001
Navigation quality predicted virtually all other satisfaction variables
Navigation quality predicted virtually all other satisfaction variables
Interaction Freedom ↔ Engagement: r = .634, p < .05
Users who enjoyed customizable features felt more engaged overall
Users who enjoyed customizable features felt more engaged overall
Design Implication: Navigation clarity was the central bottleneck. Improving this one dimension would create cascading improvements across the entire user experience.
Unexpected Finding: Conceptual Appeal vs. Execution Gap
Overall Experience ↔ Overall Satisfaction: r ≈ 0 (no linear correlation)
Users could be intellectually interested in the concept while remaining unsatisfied with the actual experience. This indicated the core idea resonated, but polish, stability, and clarity were lacking.
Strategic Takeaway: The problem wasn't market fit or concept fatigue - it was execution. With focused UX refinement, satisfaction could improve dramatically without redesigning the core product.
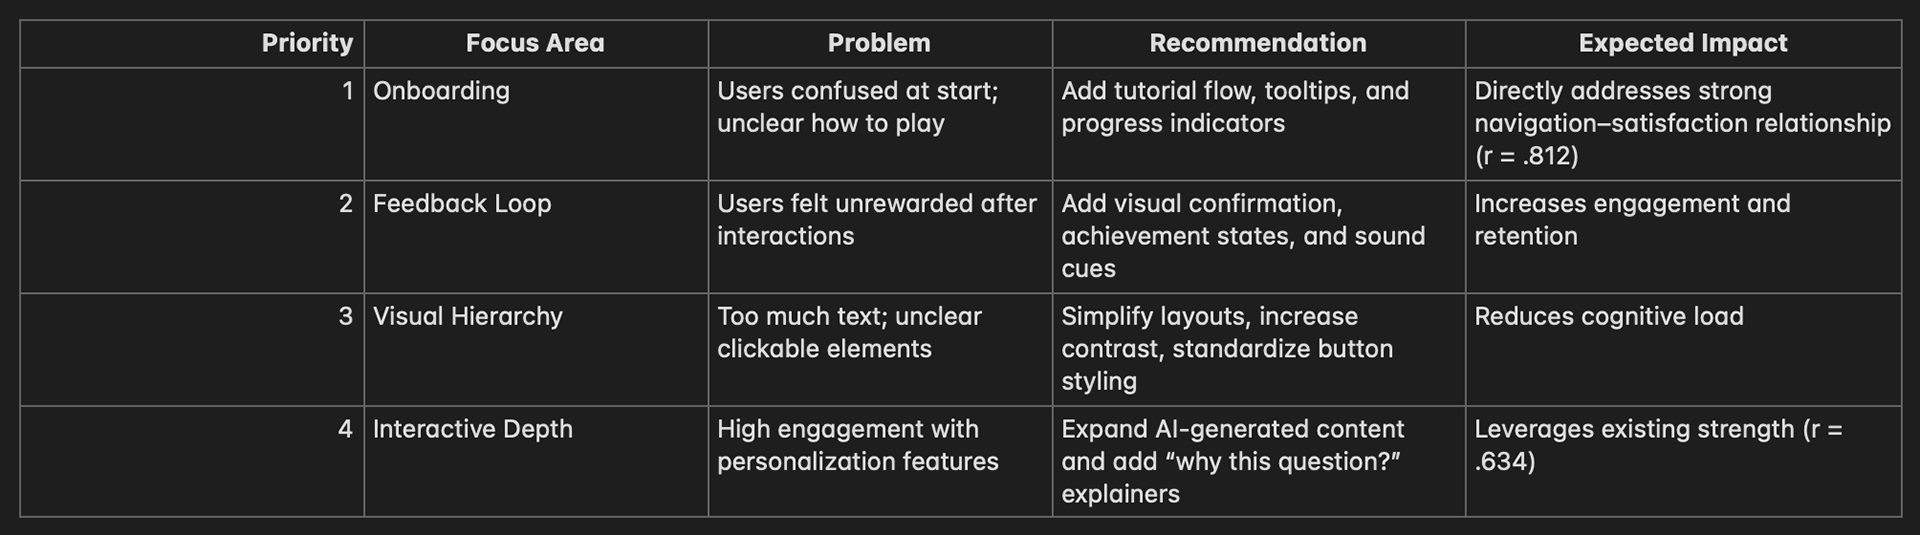
For Product Development
I delivered a prioritized action plan based on statistical evidence:
For Stakeholders
Investor-Ready Insight:
"User research shows strong conceptual validation with a clear execution gap. Statistical analysis identified navigation as the primary barrier to satisfaction (r=.812). With targeted UX improvements to onboarding and navigation flow, we project satisfaction scores will increase from 3.2 to 4.5+ (40% improvement) in the next testing cycle. The data demonstrates this is a high-potential product held back by solvable UX friction, not fundamental market-fit issues."
External Validation
Research execution and preliminary findings generated interest from Wall Street Journal technology correspondent Graham Litten, demonstrating the project's broader relevance to AR/mobile gaming innovation trends.
What This Project Demonstrates
Research Skills
Study design: Developed research protocol from scratch for novel product category
Statistical analysis: SPSS proficiency including reliability testing, correlation analysis, and inferential statistics
Mixed methods: Integrated quantitative metrics with qualitative behavioral observation
Field research: Executed rigorous research in uncontrolled, high-difficulty environment
Strategic Impact
Data-driven prioritization: Translated statistical findings into actionable product roadmap
Stakeholder communication: Framed technical findings for both product teams and investors
Independent execution: Managed complex multi-phase research operations solo
Adaptability
Real-world constraints: Maintained research quality despite environmental chaos
Resource optimization: Delivered professional-grade insights on startup timeline and budget
Technical troubleshooting: Provided real-time user support while collecting research data

Methodology Details
Tools Used:
SPSS (statistical analysis)
Google Sheets (data management)
Custom survey instruments (Likert scales, open-ended questions)
Field observation protocols
Analysis Techniques:
Descriptive statistics
Reliability analysis (Cronbach's Alpha)
Pearson correlation analysis
Qualitative thematic coding
Behavioral pattern identification
Sample Characteristics:
n = 25 (13 field testing, 12 online validation)
Mixed demographics (age range 23-55+)
Varied technical literacy levels
Real-world usage conditions

Outcome
This research provided the product team with:
Clear evidence of what was blocking user satisfaction
Statistically validated priority order for UX improvements
Quantified predictions for satisfaction improvements
Investor-ready narrative showing product viability
The findings demonstrated that with focused UX refinement targeting navigation and onboarding, the product could move from "interesting concept with execution issues" to "engaging, retention-worthy experience" - all without fundamental redesign.
The numbers showed real interest and consistency. What the product needed wasn't reinvention - it was refinement.